| | |
|
|
Investor Supplement Q1 2026 |
Investor Supplementary Financial Information
The accompanying financial information excludes all financial statement disclosures and other information required by generally accepted accounting principles in the United States of America (“GAAP”) and Securities and Exchange Commission (SEC) rules and regulations. However, MediaAlpha, Inc. ("MediaAlpha" or the "Company") has previously filed, or has publicly disclosed and will file, with the SEC, consolidated financial statements for each of the periods presented that were prepared in accordance with GAAP and SEC rules and regulations. The accompanying financial information is derived from the books and records of MediaAlpha that were used to prepare those consolidated financial statements. Accordingly, the accompanying information should be read in conjunction with MediaAlpha's consolidated financial statements and related notes thereto filed with the SEC. We believe that quarter-to-quarter comparisons of results from operations, or any other similar period-to-period comparisons, should not be construed as reliable indicators of our future performance.
The accompanying financial information includes certain non-GAAP financial measures. Definitions of these non-GAAP financial measures, as well as reconciliations to the corresponding GAAP financial metrics, have been provided on the following pages. We present these supplemental non-GAAP financial measures because they are used extensively by our management and board of directors to manage our operating performance, including evaluating our operational performance against budget and assessing our overall operating efficiency and operating leverage. Accordingly, we believe that these non-GAAP financial measures provide useful information to investors and others in understanding and evaluating our operating results in the same manner as our management team and board of directors.
These non-GAAP measures should not be considered as an alternative to net income, gross profit or any other financial measures so calculated and presented. Other companies (including our competitors) may define these non-GAAP measures differently. These non-GAAP measures may not be indicative of the historical operating results of MediaAlpha or predictive of potential future results. Investors should not consider this supplemental non-GAAP financial information in isolation or as a substitute for analysis of our results as reported in accordance with GAAP.
Effective with the first quarter of 2026, the Company is discontinuing its reporting of and guidance for Transaction Value, a non-GAAP operating metric, in order to simplify our reporting structure. As our scale advantage has become well-established, the Company believes that Revenue, Contribution and Contribution Margin, and Adjusted EBITDA are the most relevant metrics for investors evaluating the Company's performance relative to our peers.
Q1 2026 Consolidated Results
| | | | | | | | | | | | | | | |
| Q1 | | | | |
| (in millions, except percentages) | 2026 | 2025 | YoY Change | | | | |
| | | | | | | |
| Revenue | $310.0 | $264.3 | 17% | | | | |
| | | | | | | |
| | | | | | | | |
| | | | | | | | |
| Gross Profit | $46.7 | $41.6 | 12% | | | | |
Contribution 1 | $48.7 | $44.0 | 11% | | | | |
| | | | | | | |
| | | | | | | | |
Net Income (Loss) | $14.0 | $(2.3) | n/m | | | | |
Adjusted EBITDA 1 | $31.4 | $29.4 | 7% | | | | |
| | | | | | | |
| n/m - Not Meaningful | | | | | | | |
1.See “Key Business Metrics and Non-GAAP Financial Measures” for additional information regarding non-GAAP metrics and operating metrics used in this supplement.
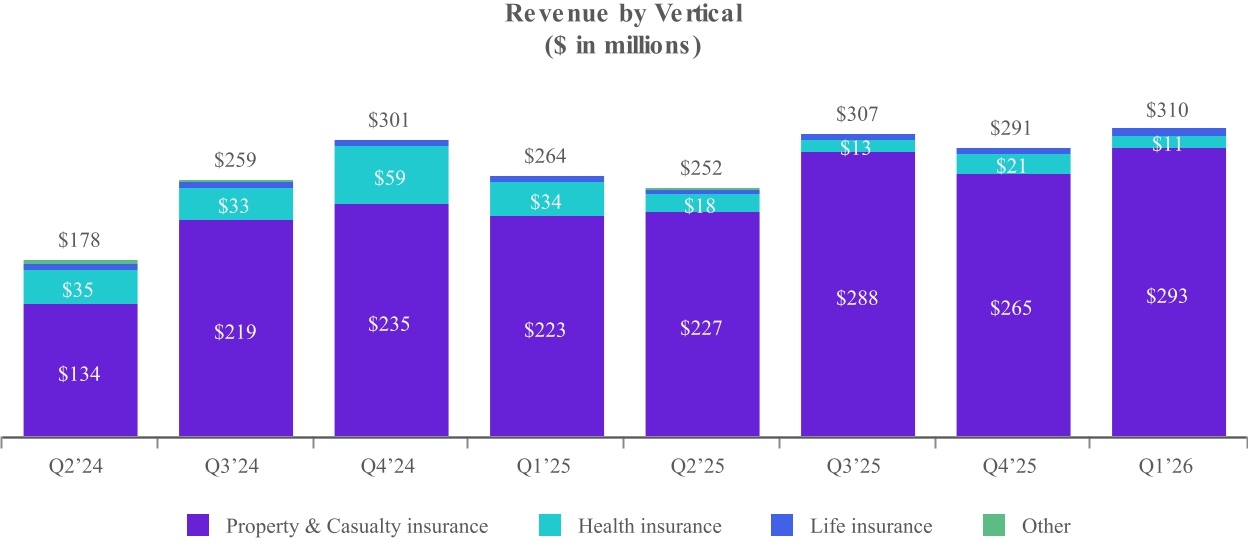
Revenue by Vertical
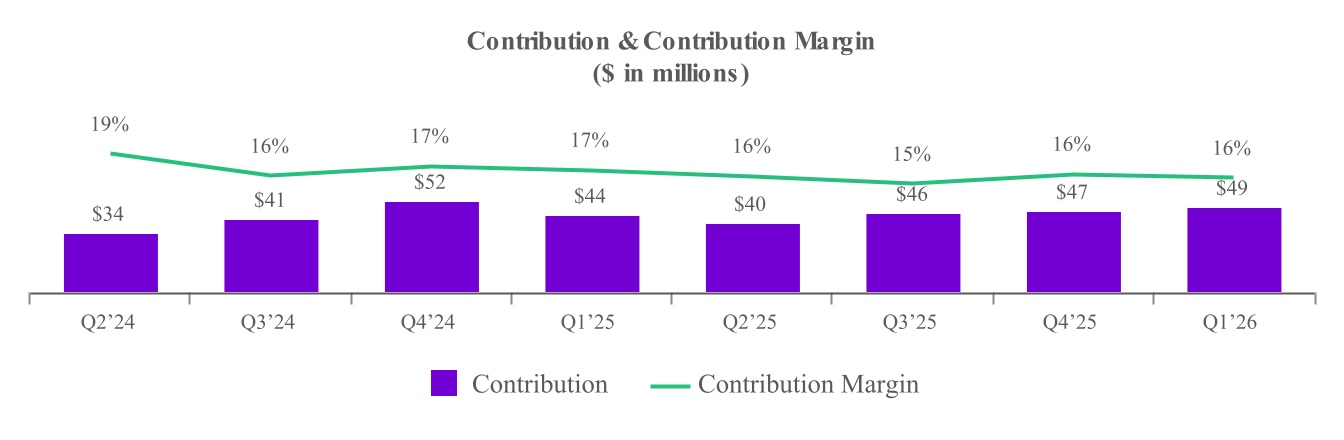
Contribution1 & Contribution Margin
1.See page 12 of this supplement for additional information regarding Contribution, a non-GAAP financial measure.
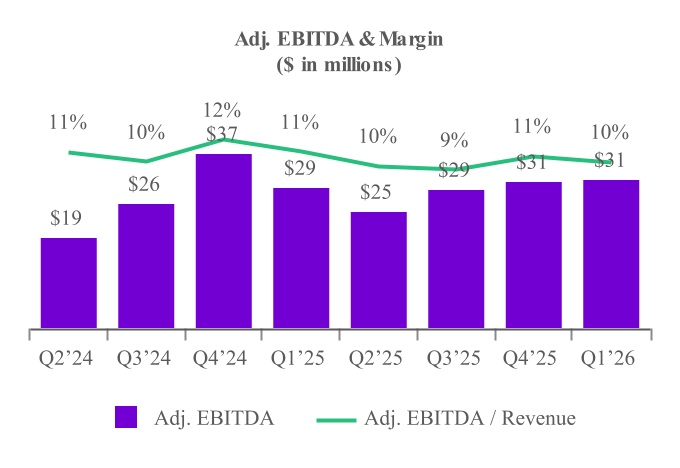
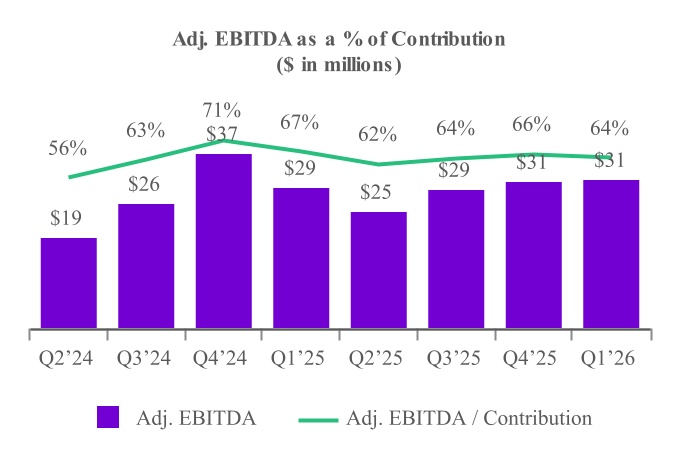
Adjusted EBITDA1 & Margin and as a % of Contribution2
1 See page 13 of this supplement for additional information regarding Adjusted EBITDA, a non-GAAP financial measure.
2 See page 12 of this supplement for additional information regarding Contribution, a non-GAAP financial measure.
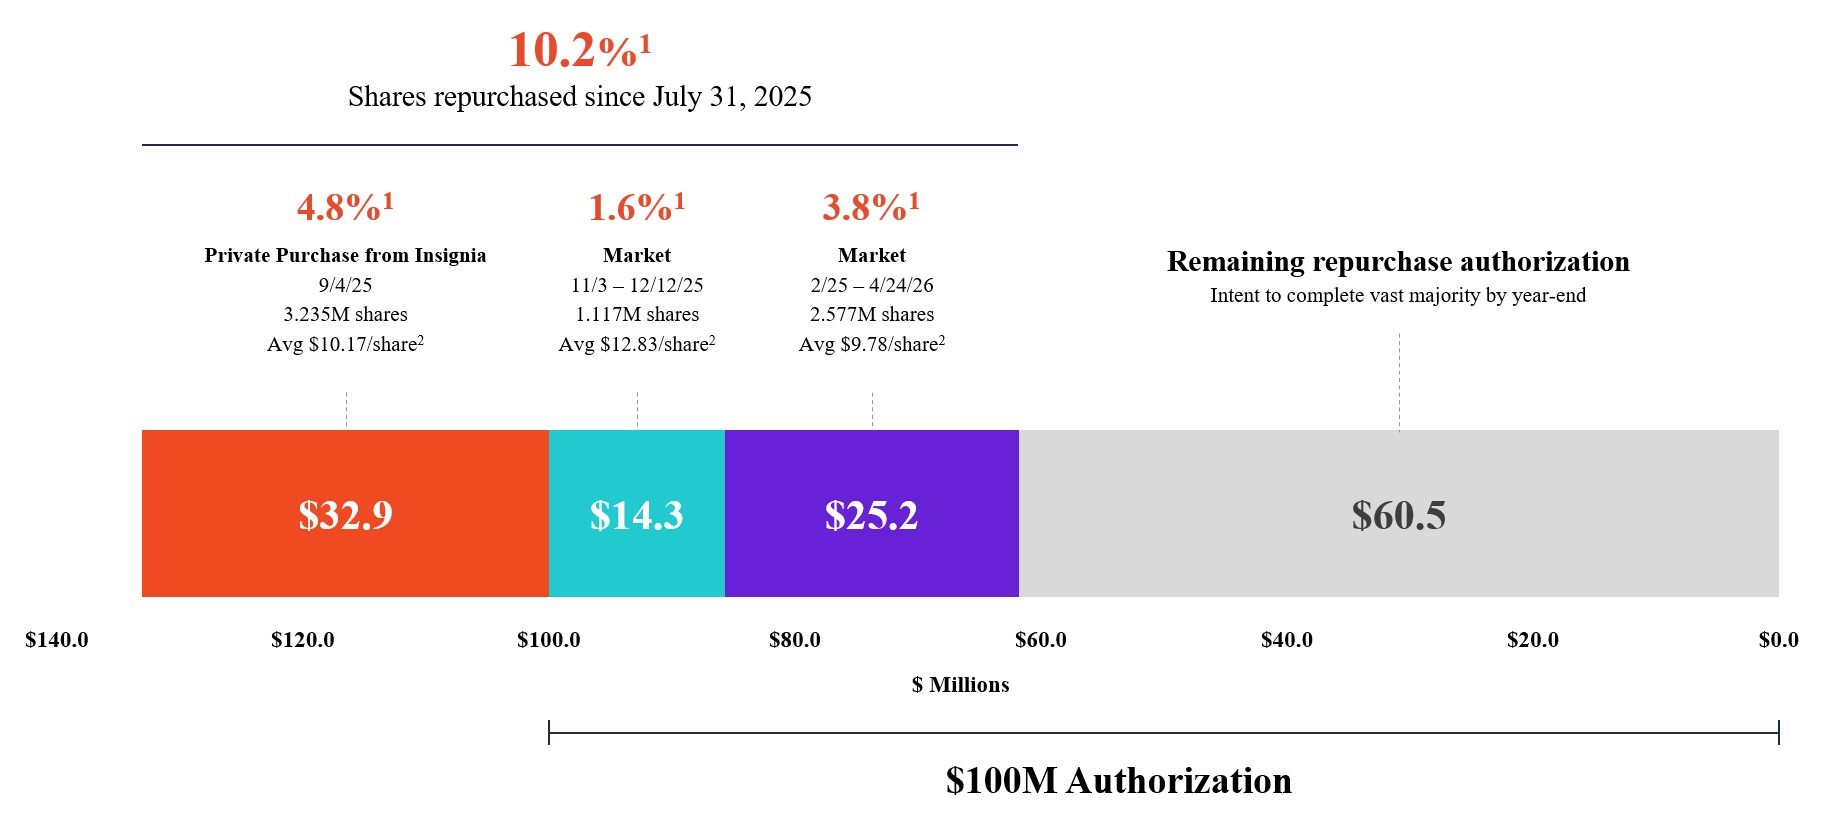
Share Repurchase Program Overview
1 Represents shares repurchased as a percentage of the 67.9 million shares outstanding as of July 31, 2025.
2 Average price derived as consideration paid, excluding any commission, divided by the number of shares repurchased.
Q2 2026 Financial Outlook
| | | | | | | | | | | | | | |
| Q2 2025 | Q2 2026 Guidance |
| ($ in millions, % year-over-year growth) | Actual | Low | Mid | High |
| | | | |
| Revenue | $251.6 | $290.0 | $300.0 | $310.0 |
| % growth | | 15 | % | 19 | % | 23 | % |
| | | | |
Contribution1 | $39.8 | $45.5 | $47.0 | $48.5 |
| % growth | | 14 | % | 18 | % | 22 | % |
| | | | |
Adj. EBITDA2 | $24.5 | $28.0 | $29.3 | $30.5 |
| % growth | | 14 | % | 19 | % | 24 | % |
| | | | |
| Under 65 Contribution | $2.4 | $0.2 | $0.3 | $0.4 |
| | | | |
| Contribution excl. Under 65 Contribution | $37.5 | $45.3 | $46.7 | $48.1 |
| % growth | | 21 | % | 25 | % | 28 | % |
| | | | |
| Adj. EBITDA excl. Under 65 Contribution | $22.1 | $27.8 | $29.0 | $30.1 |
| % growth | | 26 | % | 31 | % | 36 | % |
1 See page 12 of this supplement for additional information regarding Contribution, a non-GAAP financial measure.
2 See page 13 of this supplement for additional information regarding Adjusted EBITDA, a non-GAAP financial measure.
Key Business Metrics
and Non-GAAP Financial Measures
In addition to traditional financial metrics, we rely upon certain business metrics that are not presented in accordance with GAAP to estimate the volume of spending on our platform, estimate and recognize revenue, evaluate our business performance and facilitate our operations. Such business metrics should not be considered in isolation from, or as an alternative to, measures presented in accordance with GAAP and should be considered together with other operating and financial performance measures presented in accordance with GAAP. Also, such business and operating metrics may not necessarily be comparable to similarly titled measures presented by other companies.
Revenue
Revenue by Vertical
| | | | | | | | | | | | | | | |
| Three Months Ended March 31, | | |
| (in thousands) | 2026 | | 2025 | | | | |
| Property & Casualty insurance | $ | 292,788 | | | $ | 223,245 | | | | | |
| Percentage of total Revenue | 94.4 | % | | 84.5 | % | | | | |
| Health insurance | 11,165 | | | 33,937 | | | | | |
| Percentage of total Revenue | 3.6 | % | | 12.8 | % | | | | |
| Life insurance | 5,841 | | | 5,573 | | | | | |
| Percentage of total Revenue | 1.9 | % | | 2.1 | % | | | | |
| Other | 210 | | | 1,554 | | | | | |
| Percentage of total Revenue | 0.1 | % | | 0.6 | % | | | | |
| Total Revenue | $ | 310,004 | | | $ | 264,309 | | | | | |
Revenue by Platform Model
| | | | | | | | | | | | | | | |
| Three Months Ended March 31, | | |
| (in thousands) | 2026 | | 2025 | | | | |
| Open Marketplace transactions | $ | 303,817 | | | $ | 258,419 | | | | | |
| Percentage of total Revenue | 98.0 | % | | 97.8 | % | | | | |
| Private Marketplace transactions | 6,187 | | | 5,890 | | | | | |
| Percentage of total Revenue | 2.0 | % | | 2.2 | % | | | | |
| Total Revenue | $ | 310,004 | | | $ | 264,309 | | | | | |
Consolidated Results Excluding Under-65 Health
The tables below presents Revenue and Contribution1 (in each case as reported and excluding the results of Under-65 Health), and Adjusted EBITDA2 (as reported and excluding Contribution of Under-65 Health).
| | | | | | | | | | | | | | | | | | | | | | | | | | | |
| | Q1 2025 | Q1 2026 | Ex. U65 YoY Change |
| $ in millions | | Actual | U65 | Ex. U65 | Actual | U65 | Ex. U65 | $ | % |
| | | | | | | | | |
| Revenue | | $264 | $26 | $238 | $310 | $4 | $306 | $68 | 28% |
| Contribution | | $44 | $6 | $38 | $49 | $1 | $48 | $9 | 25% |
Adjusted EBITDA | | $29 | $6 | $24 | $31 | $1 | $31 | $7 | 28% |
1 See page 12 of this supplement for additional information regarding Contribution, a non-GAAP financial measure.
2 See page 13 of this supplement for additional information regarding Adjusted EBITDA, a non-GAAP financial measure.
Contribution to Gross Profit
We define “Contribution” as revenue less revenue share payments and online advertising costs, or, as reported in our consolidated statements of operations, revenue less cost of revenue (i.e., gross profit), as adjusted to exclude the following items from cost of revenue: equity-based compensation; salaries, wages, and related costs; internet and hosting costs; amortization; depreciation; other services; and merchant-related fees. We define “Contribution Margin” as Contribution expressed as a percentage of revenue for the same period. Contribution and Contribution Margin are non-GAAP financial measures that we present to supplement the financial information we present on a GAAP basis. We use Contribution and Contribution Margin to measure the return on our relationships with our Supply Partners (excluding certain fixed costs), the financial return on and efficacy of our online advertising costs to drive consumers to our proprietary websites, and our operating leverage. We do not use Contribution and Contribution Margin as measures of overall profitability. We present Contribution and Contribution Margin because they are used by our management and board of directors to manage our operating performance, including evaluating our operational performance against budget and assessing our overall operating efficiency and operating leverage. For example, if Contribution increases and our headcount costs and other operating expenses remain steady, our Adjusted EBITDA and operating leverage increase. If Contribution Margin decreases, we may choose to re-evaluate and re-negotiate our revenue share agreements with our Supply Partners, to make optimization and pricing changes with respect to our bids for keywords from primary traffic acquisition sources, or to change our overall cost structure with respect to headcount, fixed costs and other costs. Other companies may calculate Contribution and Contribution Margin differently than we do. Contribution and Contribution Margin have their limitations as analytical tools, and you should not consider them in isolation or as substitutes for analysis of our results presented in accordance with GAAP.
The following table reconciles Contribution with gross profit, the most directly comparable financial measure calculated and presented in accordance with GAAP, for the three months ended March 31, 2026 and 2025:
| | | | | | | | | | | | | | | |
| Three Months Ended March 31, | | |
| (in thousands) | 2026 | | 2025 | | | | |
| Revenue | $ | 310,004 | | | $ | 264,309 | | | | | |
| Less cost of revenue | (263,305) | | | (222,670) | | | | | |
| Gross profit | $ | 46,699 | | | $ | 41,639 | | | | | |
| Adjusted to exclude the following (as related to cost of revenue): | | | | | | | |
| Equity-based compensation | 143 | | | 294 | | | | | |
| Salaries, wages, and related | 345 | | | 816 | | | | | |
| Internet and hosting | 255 | | | 171 | | | | | |
Other expenses | 147 | | | 202 | | | | | |
Depreciation | 3 | | | 6 | | | | | |
| Other services | 832 | | | 712 | | | | | |
| Merchant-related fees | 240 | | | 142 | | | | | |
| Contribution | $ | 48,664 | | | $ | 43,982 | | | | | |
| Gross margin | 15.1 | % | | 15.8 | % | | | | |
| Contribution Margin | 15.7 | % | | 16.6 | % | | | | |
Adjusted EBITDA to Net Income (Loss)
We define “Adjusted EBITDA” as net income (loss) excluding interest expense, income tax expense (benefit), depreciation expense on property and equipment, amortization of intangible assets, as well as equity-based compensation expense and certain other adjustments as listed in the table below. We define “Adjusted EBITDA Margin” as Adjusted EBITDA as a percentage of revenue. Adjusted EBITDA is a non-GAAP financial measure that we present to supplement the financial information we present on a GAAP basis. We monitor and present Adjusted EBITDA because it is a key measure used by our management to understand and evaluate our operating performance, to establish budgets and to develop operational goals for managing our business. We believe that Adjusted EBITDA helps identify underlying trends in our business that could otherwise be masked by the effect of the expenses that we exclude in the calculations of Adjusted EBITDA. Accordingly, we believe that Adjusted EBITDA provides useful information to investors and others in understanding and evaluating our operating results, enhancing the overall understanding of our past performance and future prospects. In addition, presenting Adjusted EBITDA provides investors with a metric to evaluate the capital efficiency of our business. Adjusted EBITDA is not presented in accordance with GAAP and should not be considered in isolation of, or as an alternative to, measures presented in accordance with GAAP. There are a number of limitations related to the use of Adjusted EBITDA rather than net income, which is the most directly comparable financial measure calculated and presented in accordance with GAAP. These limitations include the fact that Adjusted EBITDA excludes interest expense on debt, income tax expense (benefit), equity-based compensation expense, depreciation and amortization, and certain other adjustments that we consider to be useful to investors and others in understanding and evaluating our operating results. In addition, other companies may use other measures to evaluate their performance, including different definitions of “Adjusted EBITDA,” which could reduce the usefulness of our Adjusted EBITDA as a tool for comparison.
The following table reconciles Adjusted EBITDA with net income (loss), the most directly comparable financial measure calculated and presented in accordance with GAAP, for the three months ended March 31, 2026 and 2025:
| | | | | | | | | | | | | | | |
| Three Months Ended March 31, | | |
| (in thousands) | 2026 | | 2025 | | | | |
| Net income (loss) | $ | 14,046 | | | $ | (2,334) | | | | | |
| Equity-based compensation expense | 7,259 | | | 7,024 | | | | | |
| Interest expense | 2,441 | | | 2,955 | | | | | |
| Income tax expense (benefit) | 6,502 | | | (49) | | | | | |
| Depreciation expense on property and equipment | 74 | | | 62 | | | | | |
| Amortization of intangible assets | 477 | | | 1,444 | | | | | |
Transaction expenses(1) | 1,298 | | | — | | | | | |
| | | | | | | |
Write-off of intangible assets(2) | — | | | 13,416 | | | | | |
| | | | | | | |
| | | | | | | |
| | | | | | | |
Changes in TRA related liability(3) | (803) | | | — | | | | | |
| Changes in Tax Indemnification Receivable | 17 | | | (21) | | | | | |
| | | | | | | |
Legal expenses(4) | 49 | | | 6,879 | | | | | |
| | | | | | | |
| Adjusted EBITDA | $ | 31,360 | | | $ | 29,376 | | | | | |
(1)Transaction expenses for the three months ended March 31, 2026 consist of legal and other fees of $1.1 million and a loss on extinguishment of $0.2 million incurred by us in connection with the 2026 Credit Facilities.
(2)Write-off of intangible assets for the three months ended March 31, 2025 consists of a charge related to the write-off of customer relationships and trademarks, trade names, and domain names intangible assets acquired as part of the acquisition of Customer Helper Team, LLC.
(3)Changes in TRA related liability consist of adjustments to the TRA liability to reflect probable future payments under the agreement.
(4)Legal expenses for the three months ended March 31, 2026 were immaterial. Legal expenses for the three months ended March 31, 2025, consist of an increase of $5.0 million to the loss reserve established in connection with the FTC Matter and legal fees and costs incurred in connection with such matter.